
Data flow overview
Data Flow Overview
The Data Flow Overview screen gives you an interactive, visual map of how personal data travels through one of your organisation's processing activities — from the people whose data is collected, through every system and asset that touches it, all the way to external vendors. It is the go-to screen for DPOs, compliance managers, and privacy analysts who need to show auditors or regulators exactly how data moves, without writing a word of prose. Because the map is generated directly from what you have already documented in your Record of Processing Activities (ROPA), it always reflects the real state of your records — not a separate drawing that can drift out of date.
How to open it
In the main left-hand sidebar, select Data and then choose Data Flow. The screen opens at /data/flow as a standalone page. You can also reach it directly from any ROPA record's detail page — a link there will open the map with the corresponding processing activity already pre-selected, and a Close button will appear to take you back.
Heads up: You need the Data Flow read permission to see this screen at all. If your role does not include it, you will see a "Forbidden" page instead of the canvas. Creating or deleting connections requires an additional write permission. Contact your DPMS administrator if you need access.
Heads up: The screen requires a minimum browser window size of 1024 × 768 pixels. If your window is smaller, you will see an unsupported-screen message instead of the canvas. Maximise your browser window or increase your display resolution to proceed.
What you see
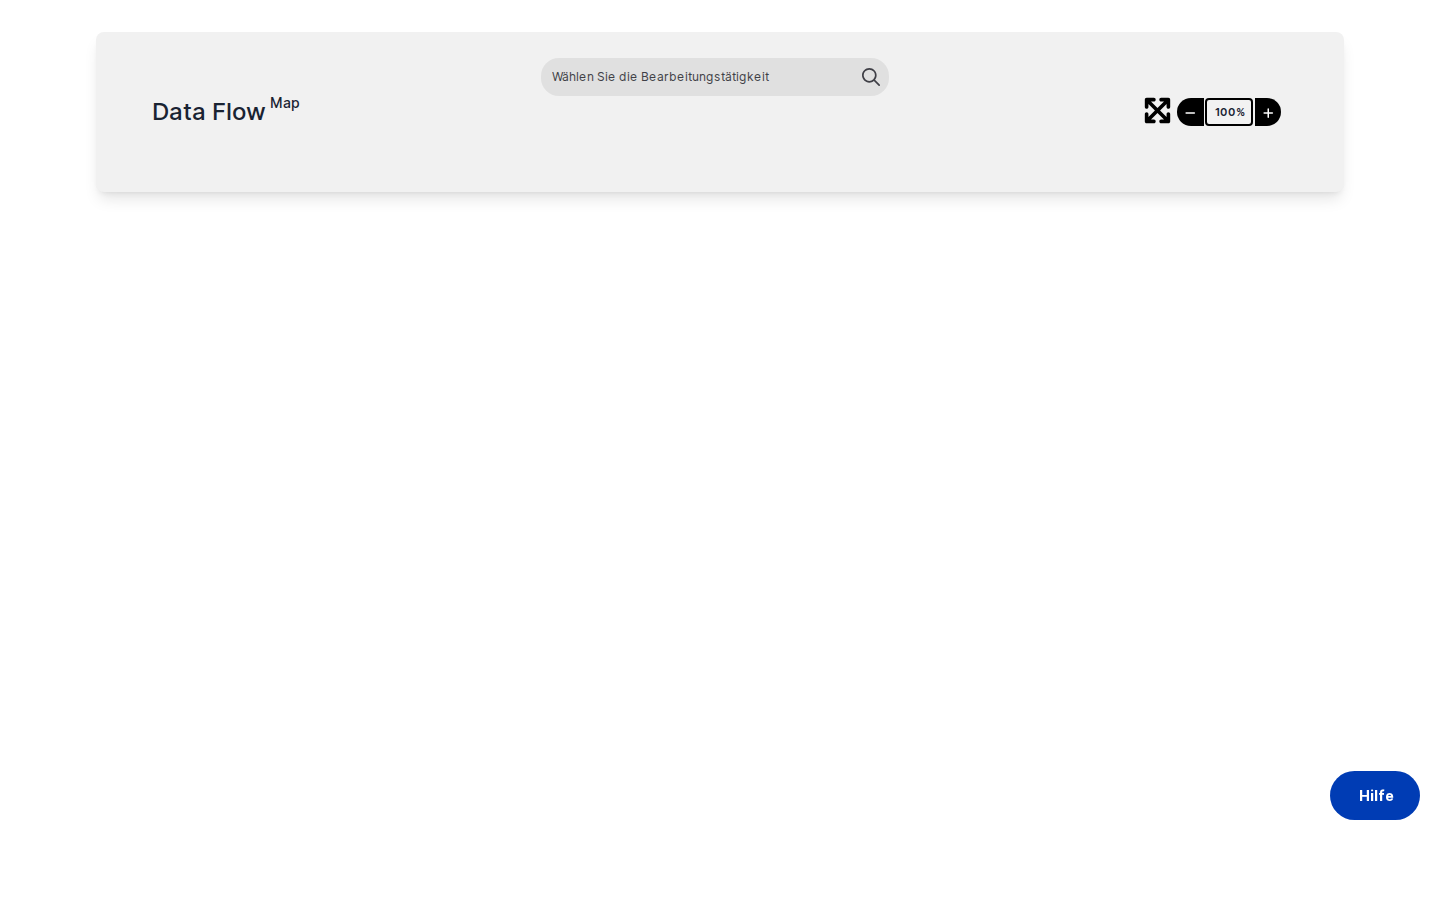
The screen is divided into two main areas. Across the top sits a wide, rounded control bar with three sections. The left section shows the screen title "Data flow map" — this is purely informational. The centre section contains the process search input and, once you have chosen a processing activity, a card confirming which one is currently selected. The right section holds the element count summary, the zoom controls, the fit-view button, and — when you arrived from a ROPA record — a Close button.
Below the control bar, the canvas fills the rest of the screen. Once you select a processing activity, coloured node cards appear arranged in horizontal rows by type: teal "Information source" cards (your data subjects) at the top, green "Data collection point" cards below them, purple "Asset" cards in the third row, and orange "Vendor" cards at the bottom. Directed lines with circle markers at the source end and arrowheads at the target end connect the nodes, showing the direction of data flow. The canvas background is almost white, making the coloured cards easy to read at a glance.
Working with this screen
Viewing the data flow map for a processing activity
You typically come here when you need to review, present, or document how data moves through a specific processing activity.
- Click inside the search input in the centre of the control bar. A dropdown of your ROPA processing activities appears. Start typing the name — for example, "Newsletter" — and the list narrows as you type.
- Select the activity from the dropdown. A small card labelled Process / [name] appears below the search input, confirming your choice.
- The canvas loads automatically. Nodes appear in their colour-coded rows, and any connections you or a colleague have previously drawn are shown as directed lines between them. The right section of the control bar updates with a count of each element type — for example, "2 Information sources · 1 Data collection point · 3 Assets · 1 Vendor."
- Click on any node to highlight all the connections that lead to or from it. The lines turn black and small X buttons appear on each edge. Click anywhere on the blank canvas to deselect and return the edges to grey.
If the activity has no linked elements yet, the canvas will be empty. In that case, you need to add affected persons, data collection points, assets, or vendors to the ROPA record first, then return here.
Drawing a new data flow connection
When you have write access and want to document a new data flow relationship, you draw a connection by dragging one node onto another.
- Identify the source node — only Information source (affected person) nodes can be dragged. The other node types have fixed positions calculated automatically by the layout engine.
- Click and hold the teal Information source node, then drag it toward the node you want to connect it to. A semi-transparent preview copy follows your cursor while the original node stays in place.
- As you drag over the target node, it begins a gentle wiggle animation — this signals that releasing your mouse here will create a connection.
- Release the mouse button. The original node snaps back to its position and a new directed line appears between the two nodes.
- The diagram saves automatically within about 200 milliseconds — there is no
Savebutton to click. The connection is now part of the permanent record.
You can then continue dragging to build a chain. For example, after connecting an Information source to a Data collection point, drag again to connect the Data collection point through to an Asset, and then from the Asset to a Vendor.
Heads up: Not every node type can be connected to every other type. If you drag a node onto another and nothing happens, the combination is not a permitted connection direction. No error message appears — the drag is simply ignored. Check the direction of the flow you are trying to create and try again.
Removing a connection
If a connection in the diagram is incorrect or no longer accurate, you can delete it without affecting any other connections in the chain.
- Click the source node of the connection you want to remove. Its edges turn black and X buttons appear near the start of each connected line.
- Click the X icon on the specific edge you want to delete.
- The line disappears immediately. If that edge was part of a longer chain, any downstream edges that depended on it are also removed automatically.
- The diagram saves automatically within about 200 milliseconds. The deletion is permanent once the auto-save fires — there is no undo.
Heads up: Because there is no undo function, take care when removing edges on complex diagrams. If you accidentally delete a connection, you will need to redraw it.
Returning to a ROPA record
When you open the Data Flow screen from a ROPA record's detail page (via the link on that page), the processing activity is pre-selected for you and the canvas loads immediately. A black Close button appears in the right section of the control bar.
Click Close to return directly to the ROPA record's General tab. The screen clears the selected process and navigates back — there is no need to use the browser's back button.
Navigating a large or complex diagram
If you have many nodes and the diagram extends beyond what is visible, use the zoom and fit-view controls in the right section of the control bar.
- Click − to zoom out and see more of the canvas at once.
- Click + to zoom in and read node labels more clearly. The current zoom level is shown as a percentage in the badge between the two buttons.
- Click the expand-arrow icon (fit-view button) once to zoom to 90%. Click it twice in quick succession (within one second) to automatically fit all nodes into the visible viewport. This is the fastest way to re-centre the diagram after you have panned far away from the nodes.
Tip: If the double-click fit-view does not trigger, you clicked too slowly. Try clicking the fit-view button twice in rapid succession — two clicks within one second.
Field reference
The screen's centre section contains the main search field. Here is what to expect:
- Process search input — Type any part of the processing activity's name. The search is case-insensitive and partial matches work fine. Results appear as a dropdown after a short pause. If no activities match your text, the dropdown shows "No options." While the search is running, a spinner appears inside the input. After you select an activity, the input continues to show the placeholder text — your selection is confirmed by the Process card that appears below.
- Selected Process card — Displays the name of the currently active processing activity. The circular X icon on the right clears the selection and returns the canvas to its empty state, letting you search for a different activity without reloading the page.
How this connects to the rest of DPMS
The Data Flow Overview screen is entirely dependent on your ROPA module. Every node on the canvas comes directly from the linked elements of the selected processing activity — the affected persons, data collection points, assets, and vendors you have already documented on that ROPA record. If those links are incomplete or missing, the canvas will be sparse. The most effective way to improve your data flow maps is to keep your ROPA records fully populated.
The screen works both as a standalone tool and as an extension of the ROPA detail page. When you arrive via a ROPA link, the Close button takes you straight back to the General tab of that record, making it easy to move between the visual map and the full record details. Any connections you draw or delete here are saved to the backend immediately, so the next person who opens the same activity's data flow will see your changes straight away.
Be aware that another user could be editing the same ROPA record at the same time. If a conflict is detected, a notification may appear. It is good practice to coordinate with colleagues before making significant changes to a shared diagram.
After finishing your data flow work, consider returning to the ROPA detail page to review the other tabs — for example, to check that your assets and vendors are correctly linked and that any newly documented connections are reflected in the broader compliance record.
Tips & common pitfalls
Tip: Only teal Information source (affected person) nodes can be dragged to create connections. The other three node types — Data collection points, Assets, and Vendors — are positioned automatically and cannot be moved. This is by design. If you find yourself trying to drag a non-teal node, you will need to start the drag from an Information source node instead.
Heads up: The canvas only appears after you select a processing activity. You cannot add elements to the canvas directly from this screen. If the canvas is empty after selecting an activity, it means the ROPA record has no linked elements of any type — go to the ROPA record and add them first.
Heads up: Changes save automatically. There is no Save button and no undo. Deleting a connection by clicking the X on an edge is permanent once the auto-save fires roughly 200 milliseconds later. Work carefully on complex diagrams.- For the double-click fit-view to work, both clicks must happen within one second of each other. Two slow clicks will each zoom the canvas to 90% instead of fitting all nodes in view.
- The screen requires a minimum viewport of 1024 × 768 px. On small laptops or when your browser window is resized below this threshold, the canvas is replaced by an unsupported-screen message. Maximise your browser window to restore the canvas.
- When arriving via a URL link from a ROPA record, the processing activity is pre-selected silently on page load. You do not need to use the search input. The appearance of the
Closebutton in the toolbar is your indicator that a process was pre-selected this way.